Dice, Probability and Bell Curve
I was playing The Settlers of Catan (a board game) with my son. The game uses two dice. Each time a player rolls the two dice and records the sum.
A simplified summary of the rules
- If the number matches the label on a land of yours, you can get some type of building materials. The lands with the label 6 or 8 are the most popular ones.
- If the number is 7, the robber rule is activated. All players will have to return half of their building materials.
I asked son: “Do you know why 7 is the number for the robber rule? Also why are the lands with the label 6 or 8 the most popular ones?”
“For the last games we played, we got the number 6, 7 and 8 many times. It was more often than the number 3 or 4.” Son replied.
“Good observation! Was it just a coincidence?”
“I don’t know.”
“It was not a coincidence. If you roll the two dice 100 times, you will very likely observe the same thing again and again. There is math behind this. Let me explain.” I continued, “Each dice has the number 1 to 6. Then we add the sum of the two dice. For the sum 7, what could the numbers on each dice be?”
“It can be 3 on one dice, and 4 on the other.” Son started thinking.
“Good, what else?”
“2 and 5, or 1 and 6.”
“Right. Note the two dice are different, so dice A = 5, B = 2 is a different case from A = 2, B = 5. For the sum 7, here are the possibilities.” I started writing on a piece of paper:
1+6
2+5
3+4
4+3
5+2
6+1
“How many possibilities are there for the sum 7?”
“6 possibilities”
“How about the sum 6 or 8?” I followed up.
For 6, there are 5 possibilities:
1+5
2+4
3+3
4+2
5+1
For 8, there are 5 possibilities as well:
2+6
3+5
4+4
5+3
6+2
Expanding to all possible numbers, here are the sum and possibilities
| Sum | Possibilities |
| 2 | 1 |
| 3 | 2 |
| 4 | 3 |
| 5 | 4 |
| 6 | 5 |
| 7 | 6 |
| 8 | 5 |
| 9 | 4 |
| 10 | 3 |
| 11 | 2 |
| 12 | 1 |
If we draw a graph, it looks like this:
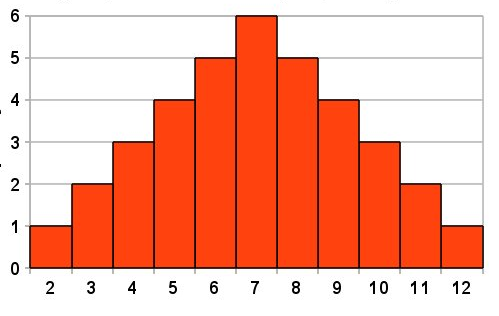
What does this shape look like? Does it look like a bell? (At least to some extent 🙂 )
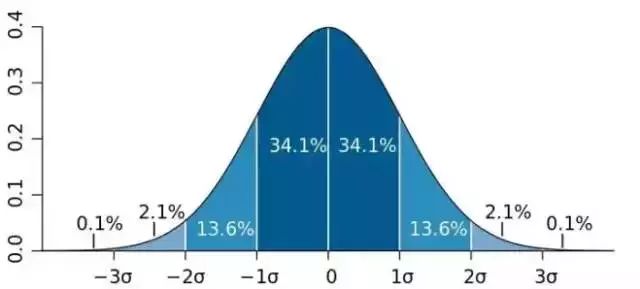
There is a branch in Math called Probability. It studies how likely an event is going to happen. For example, in our two dice experiments, it is more likely to get the sum 7 than any other number. The next likely numbers are 6 and 8, the two being equally likely. Then 5 and 9. And so on. In probability, a very common distribution is called normal distribution – see below. Guess what shape is it in?
This is called a bell curve. No need to worry about the details. If your kid remembers the bell shape, like my son, that’s good enough for now. They can learn Probability later, as long as they are interested in Math.